


SemBench is a systematic benchmark designed to evaluate and compare recent LLM-powered multi-modal data systems in realistic settings. It includes well-defined use cases that integrate structured data (tables) with unstructured modalities (text, images, audio), enabling the assessment of systems' ability to process complex semantic queries with ground truth validation. These systems are expected to balance multiple objectives—accuracy, cost, and efficiency—especially when handling large-scale datasets. SemBench emphasizes the trade-offs among these dimensions rather than performance in isolation.
Beyond the four systems evaluated in our paper (LOTUS, Palimpzest, ThalamusDB, and BigQuery), SemBench has been independently adopted by research groups worldwide.
Does your system use SemBench? Let us know and we'll feature it here!
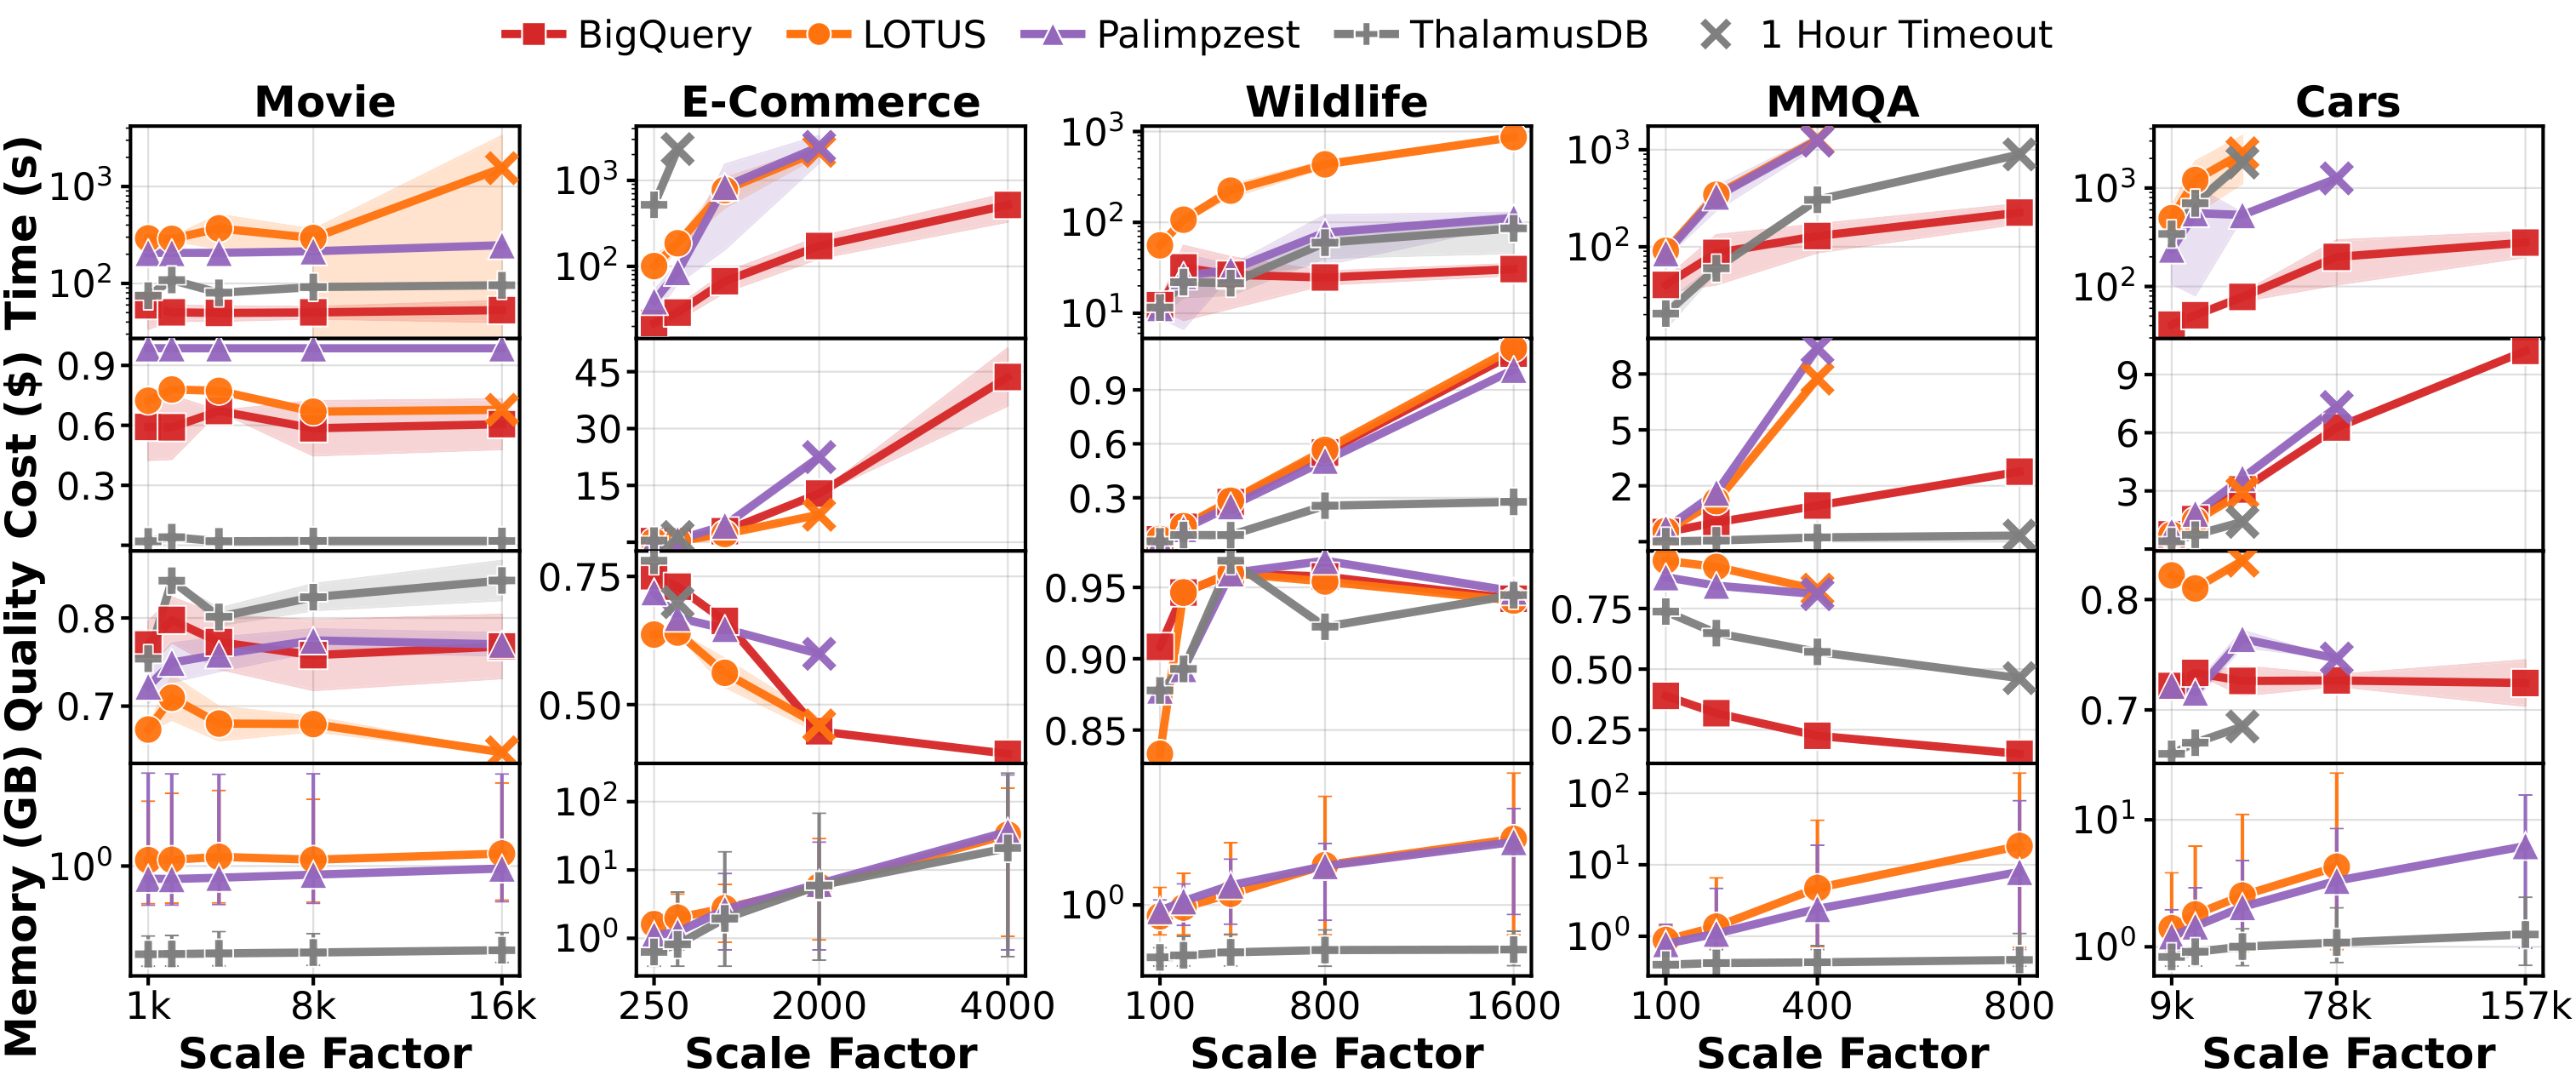
Scalability across scenarios. We report average execution time, monetary cost, result quality, and memory usage over a fixed set of queries that are supported by all systems. Error bars for execution time, cost, and result quality show standard deviations over five runs. For memory usage, error bars show the minimum and maximum values. Cross markers indicate a per-query timeout of 1 hour. After a timeout, the system is treated as failed and is not evaluated at larger scale factors. No timeout is applied in memory experiment to report the complete memory usage at the largest scales.
This analysis examines how different systems perform across all scenarios when allowing for tolerance in measurements. The tolerance analysis considers that systems with very similar results (e.g., 1.01s vs 1.04s latency) may not represent meaningful distinctions in real-world applications.
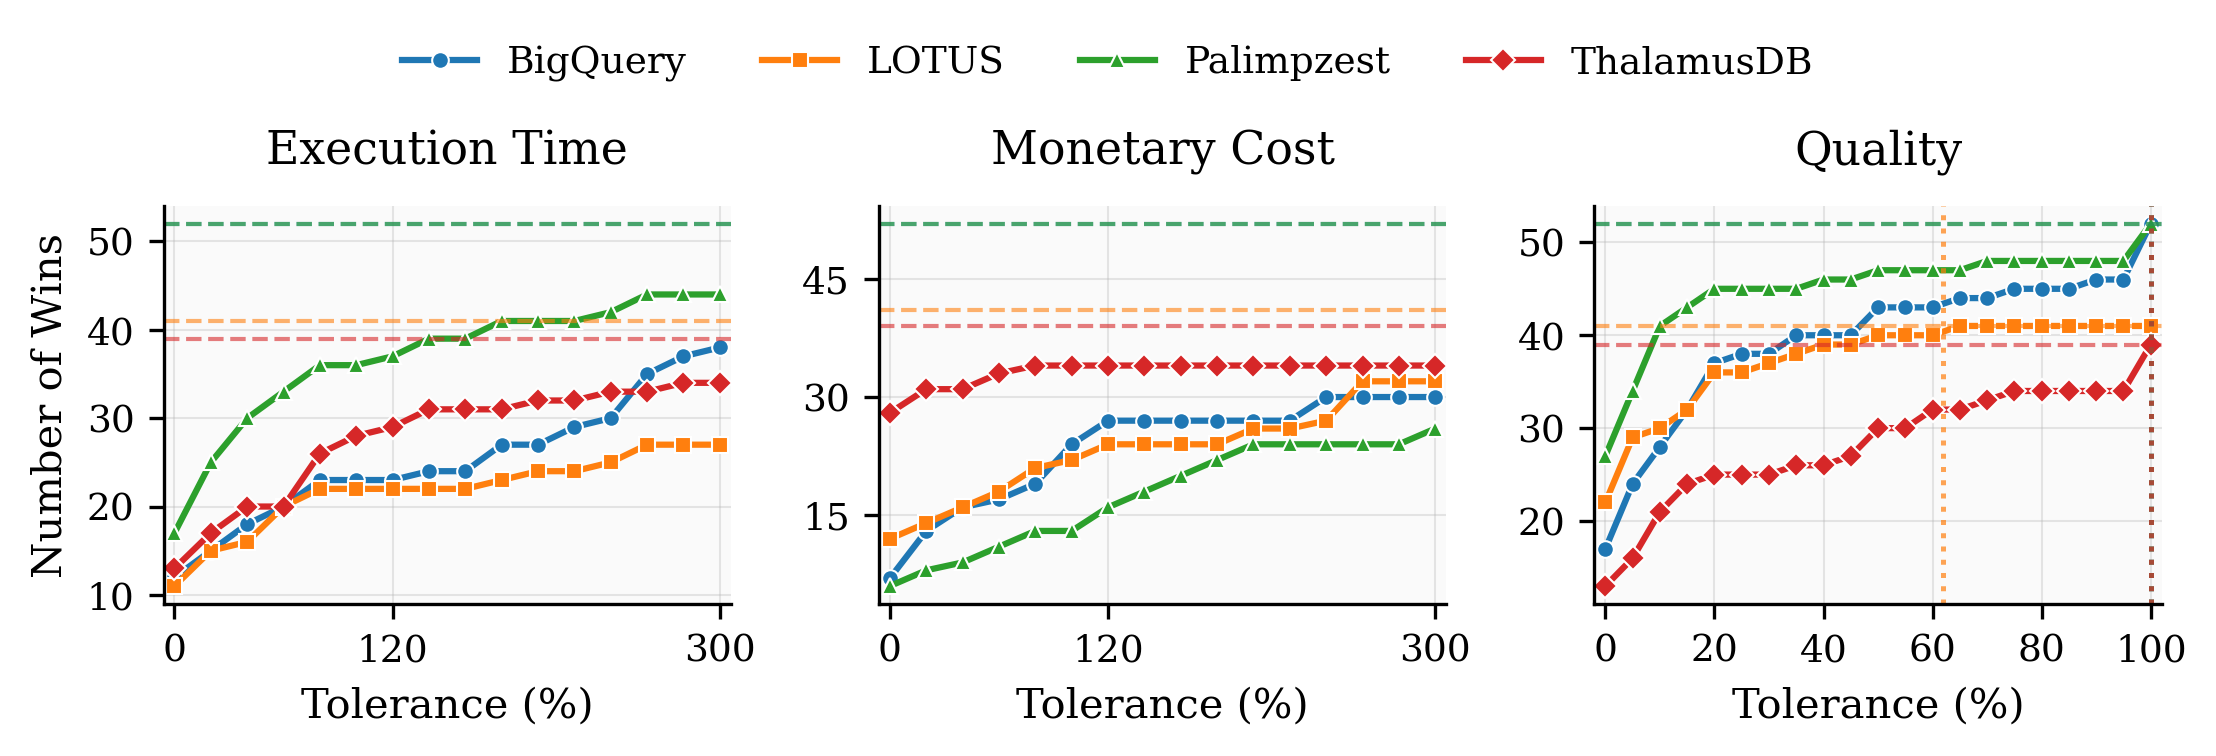
The charts above show tolerance analysis for three metrics: Execution Time, Monetary Cost, and Quality. Each colored line represents a different system's win count as tolerance increases from strict (0%) to more lenient thresholds.
Understanding the Charts: The solid lines with markers show actual wins at each tolerance level, while the horizontal dashed lines represent the upper bound (maximum possible wins for each system). The vertical dotted lines indicate the convergence tolerance where each system reaches its upper bound for that metric. For execution time and monetary cost, tolerance is relative (percentage-based), while for quality metrics, tolerance is absolute (fixed amount).
As tolerance increases, more systems become winners for queries where performance differences are small. The win count for each system should increase or remain constant as tolerance grows, since systems don't lose wins but may gain them when performance becomes similar enough to be considered equivalent.